Home Lab: SIEM and Security Features
This is part two of a four-part series on how to set up your own home lab with ELK. Read part one.

This is part four of a four-part series on how to set up your own home lab with ELK. Read part one, part two, and part three.
We’ve got a working log aggregator now and some endpoint protection on our host machine which is a great start to getting some visibility! Instead of manually searching through all of our logs though (while great in threat hunting and malware reversing/IR scenarios) we may want to help ourselves out with enabling some threat intelligence feeds and detection rules to our stack!
This will allow us to take some of the latest information from the community to help feed our SIEM and generate some alerts and also get some practice creating our own detection rules!
NOTE: Enabling the detection rules can severely degrade your stack’s performance - if you notice some severe degradation, I recommend turning on the detection rules as needed for your home-lab exercises.
Helpful Jump Links:
In one of the earlier sections, we enabled filebeat but didn’t really configure it! Now, we’re going to make sure to configure our filebeat service to ship some data to our stack.
1. We’ll start by enabling the system and threatintel modules.
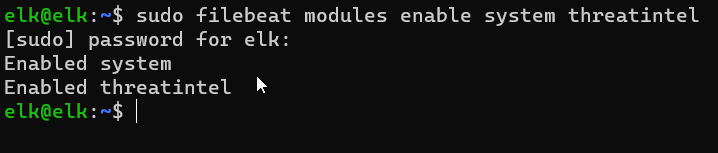
sudo filebeat modules enable system threatintel
2. To make sure we don’t run into any certificate issues, we also want to make sure we include our CA certificate to our trusted store on our ELK stack.
.png?width=1181&height=192&name=Untitled%20(1).png)
sudo cp /ca.crt /usr/local/share/ca-certificates
sudo update-ca-certificates
3. Nice! Now we’ll need to set up some credentials to allow our filebeat service to run with least privilege. We could allow it to run as the root user and it would work great - but it’s extremely insecure in the event of a compromise or vulnerability. As practice for proper Identity and Access Managment (IAM) and Role-Based Access Control (RBAC), we’ll ensure that we’re limiting the access that this service has in our cluster.
We’ll start by using the developer console to interact with our ELK stack’s Application Program Interface (API) to
filebeat_writer rolefilebeat-* index to house the logs coming from filebeatLet's get started.
1. In the search bar on our kibana web interface, search for console
.png?width=770&height=199&name=Untitled%20(2).png)
This is an area where we can interact with different endpoints to request or send different data. We can use it to query for information, such as “What users have access to the elasticstack?” or we can use it to send/update information. We’ll be using it to send information to the server via POST request to create a role and generate the API key.
2. Copy and paste the JSON block below to assign those permissions and press the Play button icon to send the request.
POST /_security/api_key
{
"name": "filebeat_writer",
"role_descriptors": {
"filebeat_writer": {
"cluster": ["monitor", "read_ilm", "read_pipeline", "manage_index_templates", "manage_ilm", "manage_ingest_pipelines"],
"index": [
{
"names": ["filebeat-*"],
"privileges": ["view_index_metadata", "create_doc", "create_index", "manage_ilm", "write"]
}
]
}
}
}
.png?width=1896&height=461&name=Untitled%20(3).png)
In the server’s response, we receive the id of the user, the name of the key, the key itself, and an encoded version of it. Take note of the id and api_key we’ll be using those in our filebeat config file next.
3. Make the changes shown below to the /etc/filebeat/filebeat.yml file to now tell it where to reach our kibana and elasticsearch services over https with the proper certificate information. You’ll also want to paste the id and key in the id:key format in the config doc.
Edit Filebeat YAML
# =================================== Kibana ===================================
# Starting with Beats version 6.0.0, the dashboards are loaded via the Kibana API.
# This requires a Kibana endpoint configuration.
setup.kibana:
# Kibana Host
# Scheme and port can be left out and will be set to the default (http and 5601)
# In case you specify and additional path, the scheme is required: http://localhost:5601/path
# IPv6 addresses should always be defined as: https://[2001:db8::1]:5601
host: "https://192.168.1.150:5601"
# ---------------------------- Elasticsearch Output ----------------------------
output.elasticsearch:
# Array of hosts to connect to.
hosts: ["https://192.168.1.150:9200"]
ssl.certificate_authorities: ["/etc/elasticsearch/certs/elasticsearch.crt"]
ssl.certificate: "/etc/elasticsearch/certs/elasticsearch.crt"
ssl.key: "/etc/elasticsearch/certs/elasticsearch.key"
# Protocol - either `http` (default) or `https`.
protocol: "https"
# Authentication credentials - either API key or username/password.
api_key: "<id>:<api_key>".png?width=1038&height=467&name=Untitled%20(4).png)
NOTE: Even while we’ve limited the “blast radius” with a limited role - having hardcoded credentials in a file like this isn’t great practice. While this is all fine in our test environment, we would be better off calling different environment variables to avoid these credentials being stored.
4. Now that we’ve made the changes, we’ll want to restart the filebeat service.
.png?width=1151&height=157&name=Untitled%20(5).png)
sudo systemctl restart filebeat
sudo systemctl status filebeat
Great! We’ve enabled some of the default threat intelligence modules and we’re almost there! In our next section, we’ll add some of the AlienVault threat intelligence feeds to our stack.
Now we’ve configured the filebeat service - let’s check out what’s available from the threat intelligence module for some of our data sources.
1. Using your favorite text editor, open the threat intelligence yaml file at /etc/filebeat/modules.d/threatintel.yml and take a look at some of the providers.
In our stack, we’ll be using:
These are all open-source providers that allow free access! The others (except for MISP) may be behind a paywall - feel free to disable them by setting the enabled value to false and save.
.png?width=1160&height=956&name=Untitled%20(6).png)
Abuseurl, abusemalware, and malware bazaar all fall under the Abuse.ch company and don’t require an API key or individual account. However, we will need to create an AlienVault OTX account if we want to ingest their threat intelligence data.
2. Open a browser and head to https://otx.alienvault.com/ to create a free account.
3. Once you’ve created your account, click your Profile Settings to get your OTX key.
Just as we set up an API key for our filebeat access to elasticsearch, we’re using an API key from AlienVault to allow our filebeat module to access AlienVault on our behalf - pretty cool right? This can be a double-edged sword however. Just as if we were protecting usernames and passwords, we want to protect these API keys and give them the same level of care as our logins.
.png?width=1617&height=743&name=Untitled%20(7).png)
4. Head back to your text editor with your /etc/filebeat/modules.d/threatintel.yml open and paste your AlienVault OTX key in.
.png?width=1741&height=487&name=Untitled%20(8).png)
otx:
enabled: true
# The authentication token used to contact the OTX API, can be found on the OTX UI.
var.api_token: <API_KEY_HERE>
5. Now take a moment to restart your filebeat service to apply those changes.
sudo systemctl restart filebeat
Once it’s successfully restarted, head to the Security Overview section of the menu in the kibana web interface and scroll down. We should see some new threat intelligence feeds being ingested - including our OTX logs!
.png?width=545&height=594&name=Untitled%20(9).png)
You will also see a prompt to load some kibana dashboards! We’ll do that here in the next section.
Dashboards can be very helpful for some at-a-glance analysis. You may see products that offer or call what they provide a single pane of glass meaning essentially you can get everything you need from one screen. While we can get maybe 50% of what we’d be looking for on a page, a single pane approach can often be neither realistic nor effective. Helpful - but not a be all, end all solution.
Let’s take a look at some of the features that we can include with some pre-built threat intelligence dashboards by configuring our new feeds to “feed” a dashboard! (See what I did there?). In order to do this, we will have to run as an elevated user with kibana_admin permissions. Because we applied an API key to connect the intelligence data feeds without those permissions, we will have to make a temporary change to our /etc/filebeat/filebeat.yml to apply the dashboards.
1. Make the temporary changes shown below to the /etc/filebeat/filebeat.yml file to allow us to generate dashboards - we will revert these after successful application by commenting out our api-key and entering our elastic username and password.
.png?width=1014&height=418&name=Untitled%20(10).png)
# ---------------------------- Elasticsearch Output ----------------------------
# Authentication credentials - either API key or username/password.
#api_key: "API_KEY"
username: "elastic"
password: "PASSWORD"
2. Refresh the service and run the following to apply the dashboards.
.png?width=755&height=157&name=Untitled%20(11).png)
sudo filebeat setup --dashboards
3. Once this completes, delete the elastic user password form your /etc/filebeat/filebeat.yml file, comment out the username and password sections and uncomment your API key as shown below.
.png?width=838&height=124&name=Untitled%20(12).png)
# ---------------------------- Elasticsearch Output ----------------------------
# Authentication credentials - either API key or username/password.
api_key: "API_KEY"
#username: "elastic"
#password: ""
4. After this final change, restart the filebeat service!
Navigate to your Discover > Dashboard section of the hamburger menu and search for Filebeat Threat Intel or any specific dashboard such as AlienVault to view an overview of the findings! In the final sections of this series, we’ll demonstrate how we can use that data to generate alerts in addition to the prebuilt detection alerts that come with the elastic agent.
.png?width=1501&height=413&name=Untitled%20(13).png)
.png?width=1900&height=819&name=Untitled%20(14).png)
Now we’re cookin' with gas! We’ve got a few good data sources sending us data from our Windows machine, and some data from threat intelligence feeds. But how do we know when there’s a match? How do we even begin to filter and alert for malicious activity? We’ll start by using ELK’s pre-built detection rules and then supplement them with some connectors of our own!
REPEAT NOTE: Enabling the detection rules can severely degrade your stack’s performance - if you notice some severe degradation, I recommend turning on/off the detection rules as needed for your home-lab exercises.
Why do these rules degrade our performance so much? Essentially these rules are a strainer for the incoming log streams. They are individual queries that each log is sifted through to check if there are any matches and alert us. If we have 300 rules enabled, there are potentially 300 queries being run on every log as it’s ingested and indexed. Some solutions take some of this load off at the agent level by pre-filtering/tagging logs, which elastic may do to a degree but either way, it can be substantial and may require some scaling in a production environment.
1. We’ll start by revisiting the Windows Endpoint agent policy we created and add the Prebuilt Security Detection Rules integration.
.png?width=398&height=260&name=Untitled%20(15).png)
.png?width=937&height=687&name=Untitled%20(16).png)
2. Next we’ll browse to the Security > Alerts section of our kibana web interface menu and select Rules.
This will show all the rules available with the community edition of ELK and even allow us to update those rules! Pretty awesome for an open-source/freemium project if you ask me.
Some of these rules may not apply to our Windows environment and we can filter using Tags applied to the rules. We’ll filter by using the tags Windows and Host. You can apply all 300 of these by clicking the Select all 300 rules and selecting Activate under the Bulk Actions dropdown.
NOTE: Some of these rules require the AI/Machine Learning components that don’t come free with the open-source version. Kibana will throw an error when you apply but it will ignore all of the AI/ML rules.
.png?width=1884&height=531&name=Untitled%20(17).png)
.png?width=1567&height=645&name=Untitled%20(18).png)
Great! Now we are that much closer to a solid SIEM! Try poking around in the SIEM dashboard and run some queries in Kibana to see your results! In our next section, we’ll write some custom rules to combine our threat intelligence data and our log data for maximum effectiveness!
In our final section of the series, we’ll connect two data sources: our log data, and our threat intelligence data to alert anytime an Indicator of Compromise is seen within our network. This is HUGE for early detection and response and helps us as defenders automate a small part of our job. That said, keeping up on the latest threats is still important - this takes off some of the load, but still requires that we stay vigilant in our networks!
To do this, we need to understand what data is being ingested into our ELK stack between our various providers and data sources and find common fields that we can match in the threat intelligence data feeds. Think about some potential indicators we might be looking for:
NOTE: Elastic has limited support for creating indicator matches from threat intelligence data. While this is good practice, some of your rules may error out depending on complexity, timeouts, etc. Unfortunately I do not have a consistent workaround for this, it depends on hardware, permissions, and could be one or more issues in tandem - you will have to troubleshoot at your own discretion should you choose to use this feature. This further illustrates my point. Tools fail no matter how many features and amazing things they may offer to make our lives easier - knowing how to look for this data on our own is ALWAYS needed.
Let’s get started with finding our data sets that we’re interested in. A few that stand out to me are file hashes, ips and urls in the threat intelligence feeds. Let’s think about where we might see those indicators in our endpoint data: Where might I find IP addresses? DNS lookups? Network connection events?
What about File Hashes? Process execution events? File change events? The list could go on.
1. Open your Kibana Discover section and search for some of the available fields in our threat intel data by switching to the filebeat-* index. Under the index section, we can search for the fields available - enter threatintel to find the fields that may match!
.png?width=1916&height=367&name=Untitled%20(19).png)
Some Notable Fields in the filebeat-* index:
threatintel.indicator.file.hash.sha256
threatintel.indicator.ip
threatintel.url.domain
2. Repeat this process by exploring what fields exist in our endpoint logs by switching to the logs-* index.
.png?width=1898&height=427&name=Untitled%20(20).png)
Some Notable Fields in the logs-* index:
source.ip
destination.ip
process.hash.sha256
dns.question.name
3. Next, we’ll navigate to Security > Alerts > Rules to generate an Indicator Match rule.
.png?width=1249&height=628&name=Untitled%20(21).png)
In this section, we’ll want to specify which indices to query against - in this case we want the logs-* index where the destination.ip: exists . We’ll bounce that off of our indicator index patterns index where our threat intel data exists and tell ELK to search for the last 30 days of indicators (in this case our IPs). It will generate an alert if the threat intel IP matches a destination IP in our log index!
.png?width=1017&height=735&name=Untitled%20(22).png)
Next, we’ll have to assign a name, description and severity to this alert. Because it’s taking live data seen in other compromises, I gave mine a high priority.
.png?width=969&height=758&name=Untitled%20(23).png)
Next, we’ll have to schedule how often this runs and account for any potential lag time. This can be SUPER resource heavy on our machine and can be an area where failures occur regularly.
.png?width=1019&height=388&name=Untitled%20(24).png)
In the last section, we could configure an alerting mechanism in slack, teams, pagerduty, or whichever other alerting system we’d like to use to let an analyst know they need to investigate an alert. This isn’t available in the free version of ELK, however there are some ways where you could set something like - jertel/elastalert2: ElastAlert 2 is a continuation of the original yelp/elastalert project. Pull requests are appreciated! (github.com) to set up some home-brewed alerting.
.png?width=1023&height=292&name=Untitled%20(25).png)
We can repeat this process with other fields listed as well!
***
I hope that this series has been helpful to understanding how we can leverage so much information to help us generate actionable intelligence and use it effectively in a SIEM. If you’d like some other project ideas, here are a few to continue to add to your SIEM stack!
Dump logs into raw JSON payloads for programmatic analysis and sample recording: elasticsearch-dump/elasticsearch-dump: Import and export tools for elasticsearch (github.com) Capture NetFlow logs from networking devices and enrich them with GeoIP information: Introduction | ElastiFlow
GeoLite2 Free Geolocation Data | MaxMind Developer Portal
Upgrade to 8.X
And so many more!
If you’ve enjoyed this series and would like to learn more about how to use these tools, analyze malware, report on your findings in a live environment, check out our free Cybersecurity Foundations course here: Cybersecurity Foundations | Level Effect.
We offer premium training designed to prepare you for breaking into cybersecurity and skill up as well - check out our CDA training program here for more information: Cyber Defense Analyst Bootcamp | Level Effect.

Check your configuration files to make sure things are proper!
Check your firewall settings to make sure the ports/IPs are accessible!
Check your certificates are installed!
Check service status with sudo systemctl status <service>
Check permissions on files, Linux users and for kibana users as well!
In other cases, Google is your friend - the ELK community is robust, you can find tons in their forums and documentation!

This is part two of a four-part series on how to set up your own home lab with ELK. Read part one.

This is part three of a four-part series on how to set up your own home lab with ELK. Read part one and part two.

Note: This is a guide that I wrote for my own home lab setup. It is not using the latest version of ELK, and there are many other great ways to get...