Home Lab: SIEM and Security Features
This is part two of a four-part series on how to set up your own home lab with ELK. Read part one.

Note: This is a guide that I wrote for my own home lab setup. It is not using the latest version of ELK, and there are many other great ways to get an ELK stack set up using Docker, prebuilt virtual machines (VMs), and many other great projects.
Building the stack manually will test your troubleshooting skills and give you a much better understanding for how these components work together so that you can utilize them in other versions and even other products. There are sections that could be scripted and automated; as much as it pains me, for the sake of this article, I made things as manual as possible for easy troubleshooting—and hopefully better understanding.
Building a cluster this way has served me well in my career and I hope that it can do the same for you! Let’s get started.
Helpful Jump Links:
According to its creators at Elastic...
"ELK" is the acronym for three open source projects: Elasticsearch, Logstash, and Kibana. Elasticsearch is a search and analytics engine. Logstash is a server‑side data processing pipeline that ingests data from multiple sources simultaneously, transforms it, and then sends it to a "stash" like Elasticsearch. Kibana lets users visualize data with charts and graphs in Elasticsearch.
We’ll start by dissecting this statement through the lens of cybersecurity—though it applies to many other areas in development and engineering to name a few. When we as defenders are trying to find a potential incident in our or a customer’s network, we need one thing at a minimum: visibility.
For our purposes, visibility == logs. Whether they’re network logs coming from our network devices such as routers, switches, and firewalls or logs showing what’s running on a user’s workstation, to piece things together effectively, we need logs. This is where the log shippers or agents come in.
Let’s take a look at the diagram below for context:
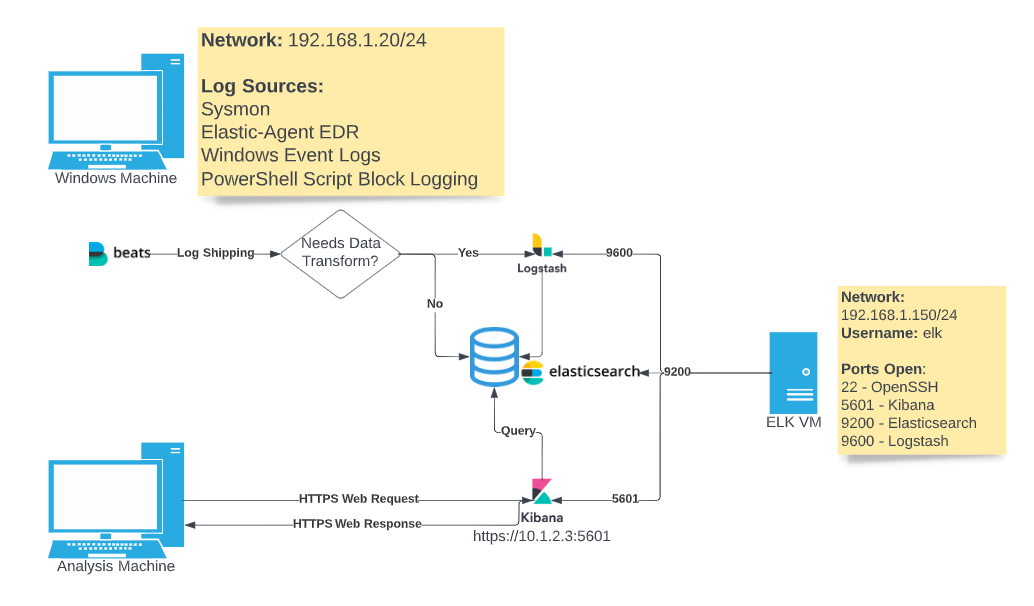
We can see on a Windows machine, we have the beats or elastic-agent installed. The beats agent is in charge of collecting logs on a machine or device that we want to monitor. We can tell it what to collect based on how we configure the agent. If we forego the beats agent for its successor the elastic-agent, we get some other great features like endpoint monitoring and alerts as well!
The question we need to ask ourselves is, “What data do I want to collect from which devices?” We can then task our collectors (beats or elastic-agent) to fetch those logs.
So, we have our little fetchers that are collecting logs on a given system. Where do we send them for storage?
This is where the elasticsearch component, or the “E” in our ELK stack, comes into play. Think of this like a database that will properly process, index, and store the data collected from our log collectors for easy retrieval. I find it helps to picture this like a library with tons of librarians taking the books (our log data) and sorting it on the proper shelves.
If there’s no title, author, or the books are written in an entirely different language, those librarians may have issues with how to properly index them. This is where the “L” of our ELK stack comes in: Logstash. Some logs have standard data structures that elasticsearch reads and knows how to index based on how it’s configured. If we wrote our own custom logs or collected them from a less known data source (or self-published book), however, we may need to send them to someone to identify and translate those logs for elasticsearch to be able to understand.
That’s the role of logstash: it takes in data, and based on how we configure it, will transform that data into a form that elasticsearch will then be able to index properly.
This is cool and all, but what good does a library of all the relevant logs in our network do us when no-one can read anything in it? This is where the “K” of our ELK stack comes in with Kibana.
I like to think of Kibana as the librarian at the resource desk. We may be looking for a specific book, a genre, or all published authors within a certain time period. We’d take this information and ask or query the librarian at the resource desk who will interact with the elasticsearch librarians to return the data you requested.
Between these three, we have lots of power at our fingertips; however, when you combine these search functions with alerting, visualizations, and even an endpoint detection agent, you can create a formidable Security Information and Events Management (SIEM) system that can give you the exposure to querying and using these tools as if you were in an enterprise environment! Talk about a good resume bullet…
So... let’s get started! First, you’ll need a hypervisor, whether it’s VirtualBox or VMWare—it doesn’t matter. You’ll also want to check the table below to make sure your host machine has enough resources to spare:
MINIMUM Hardware Requirements:
| Operating System | Ubuntu 18.04 |
| RAM | 2 GB |
| Storage | 20 GB |
| CPU | 1 core processor |
| Network | Internet connection (for install) |
RECOMMENDED Minimum Hardware Requirements:
| Operating System | Ubuntu 18.04 |
| RAM | 4-8 GB |
| Storage | 50-100 GB |
| CPU | 2+ core processors |
| Network | Internet connection (for install) |
Note: If not explicitly mentioned in this walkthrough, continue with the install on the default setting.
1. Download the Ubuntu ISO file: https://releases.ubuntu.com/18.04.6/ubuntu-18.04.6-live-server-amd64.iso
2. Run the startup process and select your language:
.png?width=803&height=586&name=Untitled%20(1).png)
3. Set the IP for your VM. Write this down! You'll need it later.
.png?width=800&height=588&name=Untitled%20(2).png)
4. Set your ELK server's name, first username, and password.
.png?width=802&height=583&name=Untitled%20(3).png)
5. Enable OpenSSH Server. This will help us remote into our VM from our host machine and let us use the clipboard to interact with it.
.png?width=798&height=585&name=Untitled%20(4).png)
6. Once the OS is installed, reboot and proceed on to the next steps.
1. Log in with the credentials you made on install.
.png?width=807&height=107&name=Untitled%20(5).png)
Once you’ve successfully logged in and see the screen below, proceed with the walkthrough.
.png?width=583&height=478&name=Untitled%20(6).png)
2. Run updates/upgrades from your apt repositories and install a compression/decompression tool for zip files:
sudo apt update && sudo apt upgrade -y
sudo apt dist-upgrade -y
sudo apt install zip unzip -y
sudo apt install jq -y
sudo reboot
Note: From here on out, we will want to SSH into our VM from our host machine. This will allow us to easily copy and paste into our terminal to make edits.
.png?width=1809&height=220&name=Untitled%20(7).png)
1. Install apt-transport-https to enable TLS/SSL-encrypted downloads from repositories and validate their certificates:
.png?width=1294&height=147&name=Untitled%20(8).png)
sudo apt install apt-transport-https -y
2. Add the elastic GnuPrivacyGuard (GPG) key to our VM and add the repo to our apt sources.
(NOTE: In the screenshot, I have && in between these commands to string them together, provided that the first apt-key add is successful).
.png?width=2882&height=344&name=Untitled%20(9).png)
wget -qO - [<https://artifacts.elastic.co/GPG-KEY-elasticsearch>](<https://artifacts.elastic.co/GPG-KEY-elasticsearch>) | sudo apt-key add -
echo "deb [<https://artifacts.elastic.co/packages/7.x/apt>](<https://artifacts.elastic.co/packages/7.x/apt>) stable main" | sudo tee /etc/apt/sources.list.d/elastic-7.x.list
We should see an OK to indicate that the GPG key is added and an echo of our /etc/apt/sources entry as a successful output. This will allow us to pull from the elasticsearch repository when we look to install the ELK components and verify that the packages are coming from a trusted source by verifying its GPG key!
3. Update the recently added elasticsearch repository and pull from it to install elasticsearch.
.png?width=2073&height=389&name=Untitled%20(10).png)
sudo apt update -y
sudo apt install elasticsearch -y
4. Now we’ll want to reload the known daemons and services on our machine to verify that elasticsearch gets properly added.
.png?width=968&height=143&name=Untitled%20(11).png)
sudo systemctl daemon-reload
5. Verify that elasticsearch is installed, but not running using systemctl
.png?width=2410&height=341&name=Untitled%20(12).png)
sudo systemctl status elasticsearch.service
Now that we’ve properly installed the elasticsearch application, we need to properly configure it so that it knows how to run, what ports it needs to open, where it needs to communicate. We can configure this by editing the yaml file associated with it.
Be careful though! YAML syntax can get finicky with unintentional spaces and other characters.
1. Open the /etc/elasticsearch/elasticsearch.yml file using your favorite text editor:
.png?width=2162&height=581&name=Untitled%20(13).png)
sudo vim /etc/elasticsearch/elasticsearch.yml
2. Edit the /etc/elasticsearch/elasticsearch.yml file to add the following (NOTE: You'll want to be sure to remove the # in front of the cluster.name and other entries. These are comment characters telling elasticsearch not to read those lines when applying settings.)
.png?width=1956&height=290&name=Untitled%20(14).png)
Note: The discovery.type entry does not exist in the default yaml file and will need to be added:
.png?width=2187&height=998&name=Untitled%20(15).png)
# ---------------------------------- Cluster -----------------------------------cluster.name: "<YourLabNameHere>"# ---------------------------------- Network -----------------------------------network.host: 192.168.1.150http.port: 9200# --------------------------------- Discovery ----------------------------------discovery.type: single-node
3. After you’ve updated the configuration file, start and enable the elasticsearch.service service. This may take a minute or two.
.png?width=2868&height=297&name=Untitled%20(16).png)
sudo systemctl start elasticsearch
sudo systemctl enable elasticsearch
4. Test to make sure elasticsearch is running properly by browsing to our VM’s IP address over port 9200.
.png?width=1508&height=853&name=Untitled%20(17).png)
curl -XGET “192.168.1.150:9200”
With the JSON response and tagline “You Know, for Search” we know that our elasticsearch service is running properly on port 9200 and is accessible! This is the port that our beats shippers/agents will use to send data to the elasticsearch database for indexing.
Now we need to install the other component we’ll be using to interact with the elasticsearch database: Kibana.
1. Install Kibana.
.png?width=949&height=448&name=Untitled%20(18).png)
sudo apt install kibana -y
2.Edit the /etc/kibana/kibana.yml file with your favorite text editor to add the following:
server.port: 5601
server.host: "192.168.1.150"
server.name: "<YourLabNameHere>"
.png?width=955&height=920&name=Untitled%20(19).png)
3. Start and enable the Kibana service and restart elasticsearch (this is always a good practice when restarting either service as Kibana and elasticsearch are very dependent on each other).
.png?width=1079&height=84&name=Untitled%20(20).png)
sudo systemctl start kibana
sudo systemctl enable kibana
sudo systemctl restart elasticsearch
4. Check the status of both the elasticsearch and Kibana services before moving on to the next step (NOTE: If you run the command as pictured in the screenshot, you will have to press “Q” to see the next output):
.png?width=1086&height=624&name=Untitled%20(21).png)
sudo systemctl status kibana
sudo systemctl status elasticsearch
Now that we’ve established the kibana and elasticsearch services on our machine, we can add Logstash to help with any potential logs that elasticsearch may not know how to index by default and filebeat to get some other cool features and monitoring on our VM itself. This section is optional but encouraged!
1. Install and enable Logstash.
.png?width=1091&height=68&name=Untitled%20(22).png)
sudo apt install logstash -y
sudo systemctl start logstash
sudo systemctl enable logstash
This will get the foundation laid for our Logstash service; however, configuring pipelines with Logstash will be outside of the scope of this article.
1. Install Filebeat.
![]()
sudo apt install filebeat -y
2. Edit the /etc/filebeat/filebeat.yml file with your favorite text editor to add the following entry to connect to our elasticsearch service.
# ================================== Outputs ===================================# Configure what output to use when sending the data collected by the beat.# ---------------------------- Elasticsearch Output ----------------------------output.elasticsearch:# Array of hosts to connect to.hosts: ["192.168.1.150:9200"]
.png?width=1049&height=295&name=Untitled%20(24).png)
Now we’ve set up some basic logging to send logs to elasticsearch over port 9200! We’ll want to test it now to make sure it’s collecting logs and sending it for proper indexing. (NOTE: We will have to change this once we start enabling security features.)
3. Run the Filebeat setup commands with the following arguments to tell Filebeat we don’t need Logstash logging and to ensure we have the proper host configured in our yml file:
.png?width=1468&height=237&name=Untitled%20(26).png)
sudo filebeat setup --index-management -E output.logstash.enabled=false 'output.elasticsearch.hosts=["192.168.1.150:9200"]'
sudo systemctl start filebeat
sudo systemctl enable filebeat
4. Run another curl command to check and make sure our indices are working properly to ingest the logs from Filebeat.
.png?width=1576&height=153&name=Untitled%20(27).png)
curl -XGET http://192.168.1.150:9200/_cat/indices?v
We can see that the index health is currently “yellow” with zero documents being sent—this is okay for now. We will come back and revisit after enabling some security features in our next blog!
Read part two, where we dive into SIEM and security features!

This is part two of a four-part series on how to set up your own home lab with ELK. Read part one.

This is part three of a four-part series on how to set up your own home lab with ELK. Read part one and part two.

This is part four of a four-part series on how to set up your own home lab with ELK. Read part one, part two, and part three.