Home Lab: SIEM and Security Features
This is part two of a four-part series on how to set up your own home lab with ELK. Read part one.

This is part three of a four-part series on how to set up your own home lab with ELK. Read part one and part two.
We’ve made the library—now we need to fill it with our log books! Let’s work on tweaking our filebeat setup to work over https and also get some agents to ship some logs to our shiny new ELK stack.
We’ll be using a combination of filebeat and some elastic-agents to forward log data to our stack. With version 7.x+ though, there’s a great feature called fleet. This is another service that we will use to manage our deployed agents and choose what types of logs we’d like them to send.
Helpful Jump Links:
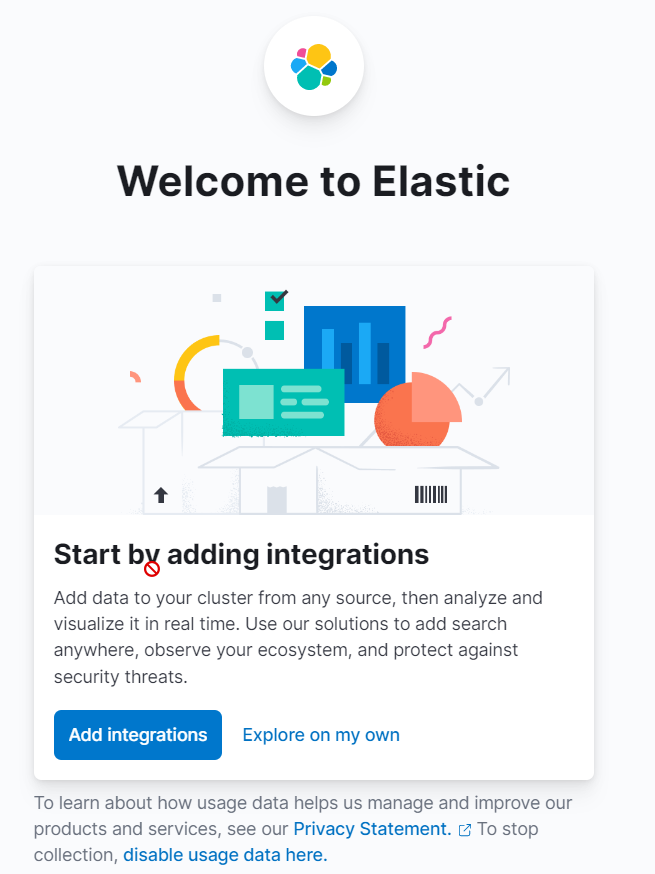
1. After logging into ELK, we’ll be faced with a prompt to add some data to ELK. We’ll select explore on my own.
2. Browse the hamburger menu on the left for the Fleet section:
.png?width=311&height=841&name=Untitled%20(1).png)
3. After a wait, we’ll be faced with a prompt to set up our fleet service. Make sure you have the following selected—skip the Download the Fleet Server to a Centralized Host section for now. We’ll come back to that shortly.
Select an Agent Policy-------------------------------------> Agent Policy: Default Fleet Server PolicyChoose a Deployment Mode for Security-------------------------------------> Production - Provide your own certificates. This option will require agents to specify a cert key when enrolling with Fleet.Add your Fleet Server Host-------------------------------------> https://192.168.1.150:8220
.png?width=1469&height=560&name=Untitled%20(2).png)
4. After adding our fleet server host, we’ll want to generate a service token for fleet to also be able to interact with the elasticsearch database. Again, it’s not a bad idea to save this token in a password manager just in case!
.png?width=1546&height=681&name=Untitled%20(3).png)
5. Now let’s ssh back into our machine to install the elastic-agent and change directories to the /etc/fleet directory we made while we were generating our certs. We will download the bundle as a tar.gz often referred to as a tarball.
.png?width=1457&height=420&name=Untitled%20(4).png)
sudo wget https://artifacts.elastic.co/downloads/beats/elastic-agent/elastic-agent-7.17.6-linux-x86_64.tar.gz
6. This is a compressed directory with all the goodies we need inside—we’ll want to decompress it next:
.png?width=938&height=227&name=Untitled%20(5).png)
sudo tar -xvf ./elastic-agent-7.17.6-linux-x86_64.tar.gz
7. (Optional) Remove the tar.gz file.
sudo rm ./elastic-agent-7.17.6-linux-x86_64.tar.gz
8. Now let’s return to our Kibana web interface at https://192.168.1.150:5601 to copy the install commands (we’ll want to alter them to provide our own certificates that we created). I recommend pasting this in a notepad to make edits.
.png?width=1474&height=547&name=Untitled%20(6).png)
9. Now we'll head back to our ssh connection to cd into the elastic agent directory we unpacked and run our edited enrollment sequence.
.png?width=945&height=659&name=Untitled%20(7).png)
sudo ./elastic-agent install --url=https://192.168.1.150:8220 \--fleet-server-es=https://192.168.1.150:9200 \--fleet-server-service-token=InsertTokenHere \--fleet-server-policy=499b5aa7-d214-5b5d-838b-3cd76469844e \--certificate-authorities="/etc/fleet/certs/ca/ca.crt" \--fleet-server-es-ca="/etc/elasticsearch/certs/elasticsearch.crt" \--fleet-server-cert="/etc/fleet/certs/fleet.crt" \--fleet-server-cert-key="/etc/fleet/certs/fleet.key"
Now we can check on our web interface and we should see that our Fleet server is connected!
.png?width=725&height=214&name=Untitled%20(8).png)
And after clicking continue, we can see that it has a healthy connection in the fleet management page!
.png?width=1537&height=536&name=Untitled%20(9).png)
Now in the upper right - we’ll want to configure fleet settings to be sure that our fleet server can talk with elasticsearch.
.png?width=367&height=114&name=Untitled%20(10).png)
We should already see our fleet server set at https://192.168.1.150:8220 but we will also want to be sure to change our elasticsearch server to https://192.168.1.150:9200 from localhost.
IMPORTANT NOTE: If we don’t make this setting change, we will see healthy agents but ZERO logs being shipped. Make sure you don’t skip this step!
.png?width=919&height=761&name=Untitled%20(11).png)
Save and apply these settings - we’re now ready to start selecting the types of logs we want to include!
You may be wondering, “Why the heck are we setting up Fleet? Don’t we have everything we need to ingest logs?” and you’d be right! However, it can be really difficult to keep track of what agents exist, what logs they’re collecting, and plenty of other issues with individual agents. This is where the power of fleet comes in. It gives us one place to centrally manage all of our agents and what logs they’re meant to collect. Almost like our own Command and Control (C&C/C2) server for log collectors!
For us to specify what logs we want to collect, we will be creating policies to state which logs we’d like to collect. For example, if I wanted to collect logs from my router vs. logs from my Windows workstation, I’d want to collect very different logs! We’d solve this by creating two separate policies: one for Windows, and one for our router. Then when we install an agent on that endpoint we’re monitoring, we tell it which policy to enroll under. Pretty cool huh?
In this article, we’ll only be creating a Windows policy for endpoint monitoring but you can take the steps we apply here and use them to enroll other devices as well!
1. Click the Agent Policies tab under our Fleet management pane and select Create Agent Policy.
.png?width=1510&height=511&name=Untitled%20(33).png)
2. From here, we’ll name and create a description for our policy. By having the Collect System Logs and Metrics box checked, we can get metadata on the elastic agent’s performance logs and some Windows system logs for troubleshooting the agent!
.png?width=860&height=773&name=Untitled%20(13).png)
Now we’ll want to select our created policy to add integrations to it. These integrations will tell our elastic agent what types of logs to collect and from where. When we add these integrations to our policy, once we enroll our agents, they will connect to the fleet server to determine how they need to configure themselves for collecting logs and apply those changes! No need to manually ssh into tens, hundreds, or thousands of machines to apply things separately!
3. Select Add Integration on this page:
.png?width=1508&height=468&name=Untitled%20(14).png)
There are TONS of integration options that we can add here for application monitoring, cloud, and so many others! For our purposes, we will select the Security integrations.
.png?width=1486&height=754&name=Untitled%20(15).png)
We’ll start with adding the Endpoint Detection and Response (EDR) functionality to our policy by adding the Endpoint Security integration.
.png?width=1589&height=681&name=Untitled%20(16).png)
4. Give your integration a name and description and ensure you’re attaching this integration to the Windows Endpoints policy we created. Click Save and Continue.
.png?width=1063&height=679&name=Untitled%20(17).png)
Once this has completed, we’ll receive a popup prompting us to add an agent to this policy - we’ll add it in the next section after we’ve fully configured our policy.
.png?width=942&height=247&name=Untitled%20(18).png)
IMPORTANT NOTE: If you’re running malware on your Windows machines and would like to allow that malware to run - we’ll have to change the default setting for our Endpoint Security from prevent to detect to allow those samples to run and still generate the endpoint logs by editing our Security Integration.
.png?width=954&height=524&name=Untitled%20(19).png)
We’ll repeat this process with the Windows integration, ensuring we select the sources shown below. This will allow us to collect logs from various event log sources including: Windows Event Logs, Windows PowerShell Script Block Logging, and Sysmon. We will have to do some configuration on the endpoint to set this up—or, in the case of a Windows Active Directory environment, we could apply this via Group Policy. We’ll get to that part in the next section when we enroll our agent.
.png?width=880&height=694&name=Untitled%20(20).png)
We will also want to point our elastic agent to our ca.crt file installed on it. Be sure to click the Show Advanced Settings section and scroll down to windows.advanced.elasticsearch.tls.ca_cert.
This is where we’ll put in the file path for our public CA certificate so that we can properly connect to the cluster to ship logs. In this case, I put mine in C:\Windows\System32\ca.crt.
.png?width=1125&height=372&name=Untitled%20(21).png)
Now we’re in a good spot - let’s switch over to our machine that we’re planning on monitoring. In our scenario, I’m using a Windows 10 Virtual Machine that’s in the same 192.168.1.0/24 subnet as our monitoring workstation. Let’s make sure that it can connect to our ELK stack over the required ports 9200:elasticsearch and 8220:fleet.
1. Open a PowerShell terminal on your Windows machine and run the following Test-NetConnection commands to test proper connectivity on the given ports:
.png?width=667&height=414&name=Untitled%20(22).png)
Test-NetConnection -port 9200 192.168.1.150
Test-NetConnection -port 8220 192.168.1.150
With our TcpTestSucceeded status as “True” we can see that there’s some good connectivity between our workstation and the ELK cluster. We’ll want to change some settings to make sure we capture the proper logs and install sysmon as well.
Before we begin, what is sysmon? Sysmon is a tool as part of a suite of Windows tools to help monitor and triage what occurs on that Windows machine. According to the documentation...
System Monitor (Sysmon) is a Windows system service and device driver that, once installed on a system, remains resident across system reboots to monitor and log system activity to the Windows event log. It provides detailed information about process creations, network connections, and changes to file creation time. By collecting the events it generates using Windows Event Collection or SIEM agents and subsequently analyzing them, you can identify malicious or anomalous activity and understand how intruders and malware operate on your network. Sysmon - Windows Sysinternals | Microsoft Learn
By installing this on our Windows machine and configuring Windows Event Viewer properly, we can get a ton of information to help us understand what’s happening when a machine is potentially compromised.
2. Now let’s download the sysmon executable and using PowerShell - open PowerShell as Administrator to run the following:
.png?width=961&height=191&name=Untitled%20(23).png)
Invoke-WebRequest -URI https://download.sysinternals.com/files/Sysmon.zip -OutFile "C:\Program Files\Sysmon.zip"Expand-Archive "C:\Program Files\Sysmon.zip" -DestinationPath "C:\Program Files\Sysmon"
Now we’ve downloaded the zip file and unpacked it in our C:\Program Files folder. This is a restricted folder for regular users which is why we needed that Administrator privilege. Now, just as we had to set up our agents to know what to collect, we will also need a configuration file for our sysmon setup. There is a great template from SwiftOnSecurity at sysmon-config. We’ll be downloading it and applying it in the section below.
3. In the same Administrator PowerShell window, run the following to download and run sysmon by applying our config file.
.png?width=1467&height=395&name=Untitled%20(24).png)
cd "C:\Program Files\Sysmon"Invoke-WebRequest -URI https://raw.githubusercontent.com/SwiftOnSecurity/sysmon-config/master/sysmonconfig-export.xml -OutFile "C:\Program Files\Sysmon\sysmonconfig-export.xml"./sysmon.exe -accepteula -i sysmonconfig-export.xml
We’re about 50% of the way there. Now, we need to make sure we have PowerShell script block logging enabled. This will allow us to log every script that’s been run on the machine through PowerShell to see what it’s been doing!
4. In the same PowerShell window, run the following function to update the registry to log PowerShell script execution.
.png?width=642&height=326&name=Untitled%20(25).png)
function Enable-PSScriptBlockLogging{$basePath = 'HKLM:\Software\Policies\Microsoft\Windows' +'\PowerShell\ScriptBlockLogging'if(-not (Test-Path $basePath)){$null = New-Item $basePath -Force}Set-ItemProperty $basePath -Name EnableScriptBlockLogging -Value "1"
}
This will check to see if the registry key exists for script block logging - if it doesn’t it will create the key and set its value to the boolean true value of “1”.
Now we’re in a great spot. Our machine is primed for proper logging and ready for the elastic-agent installation. However we have a core issue we need to fix here - our machine doesn’t trust the certificate authority! So how do we tell our machine to trust the certificates coming from the ELK stack? We ask it to import the certificate as a trusted certificate authority.
Your browsers have this built in from known authorities that allow us to trust and verify different websites! If you check in your browser and search the settings for certificates you can see which authorities your browser trusts.
.png?width=574&height=294&name=Untitled%20(26).png) 1. To import the certificate, you will want to run the following to Secure Copy the ca.crt file that we have stored in our
1. To import the certificate, you will want to run the following to Secure Copy the ca.crt file that we have stored in our root directory on our ELK stack.
Windows Host Certificate Import
2. As an Administrator with PowerShell run the following:
scp elk@192.168.1.150:/ca.crt ./
Import-Certificate -CertStoreLocation Cert:\LocalMachine\Root -FilePath ./ca.crt
Linux Host Certificate Import
3. In the Linux terminal:
scp elk@192.168.1.150:/ca.crt /usr/local/share/ca-certificates/
sudo update-ca-certificates
Great! Now we have the certificate authority imported and our machine will “know” our self-signed certificate authority because we’ve told it to trust it as a Root Certificate Authority. Now, we need to install the elastic-agent and tell it to connect to our fleet server.
4. Now run the following on your Windows machine in a PowerShell window as Administrator to download the elastic-agent bundle and prep us for configuration and setup.
Windows Elastic Agent Download
Start-BitsTransfer -Source https://artifacts.elastic.co/downloads/beats/elastic-agent/elastic-agent-7.17.6-windows-x86_64.zip -Destination "C:\Program Files\elastic-agent.zip"|Expand-Archive "C:\Program Files\elastic-agent.zip" -DestinationPath "C:\Program Files\elastic-agent"rm "C:\Program Files\elastic-agent.zip"
Linux Elastic Agent Download
sudo wget https://artifacts.elastic.co/downloads/beats/elastic-agent/elastic-agent-7.17.6-linux-x86_64.tar.gz -O /opt/elastic-agent-7.17.6-linux-x86_64.tar.gzsudo tar -xvf elastic-agent-7.17.6-linux-x86_64.tar.gzsudo rm ./opt/elastic-agent-7.17.6-linux-x86_64.tar.gz
Once we’ve downloaded the executable - head back to the Kibana Web Interface to get the commands to enroll our agent with our fleet server.
.png?width=1539&height=441&name=Untitled%20(27).png)
5. Select Add Agent and ensure the agent policy is set for our Windows enrollment. Scroll down to get the command to enroll our agent in our PowerShell window (or Linux terminal if you’re enrolling a Linux machine). We will want to change directories to where we downloaded our elastic-agent (C:\Program Files\elastic-agent (Windows) or \opt\elastic-agent (Linux))
.png?width=904&height=412&name=Untitled%20(28).png)
.png?width=1693&height=173&name=Untitled%20(29).png)
.\elastic-agent.exe install --url=https://192.168.1.150:8220 --enrollment-token=<token> --certificate-authorities="C:\Windows\System32\ca.crt"
We’ll see now in our Fleet pane that there is a healthy agent running under our custom Windows Agent Policy as well! Now, let’s head to the Kibana discover section to see our shiny new logs!
.png?width=1508&height=615&name=Untitled%20(30).png)
6. In the hamburger menu, select Discover under the Analytics (kibana) section. This is where you can query the logs that have been stored and indexed in elasticsearch!
.png?width=295&height=483&name=Untitled%20(31).png)
And just like that - we have some data being shipped in!
.png?width=1896&height=364&name=Untitled%20(32).png)
For the final post of this blog series, we’ll use the filebeat module running on our ELK stack to import some threat intelligence data! Stay tuned!

This is part two of a four-part series on how to set up your own home lab with ELK. Read part one.

This is part four of a four-part series on how to set up your own home lab with ELK. Read part one, part two, and part three.

Note: This is a guide that I wrote for my own home lab setup. It is not using the latest version of ELK, and there are many other great ways to get...